425/525 Statistical Methods
Spring 2011
Instructor: Michael McCourt
SPSS References: Conducting One-Sample t Tests
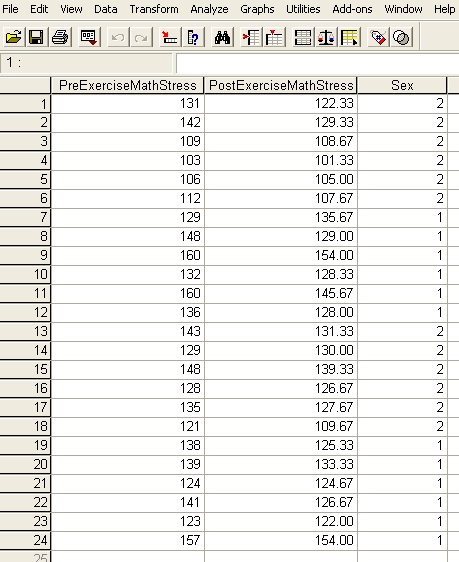
For this tutorials let's take a look at the Systolic Blood Pressure data set in the SPSS main page. In fact, to make things simpler, let's only look at the math stress columns and the Sex identifier. If we delete all columns except those we are left with just the data below.
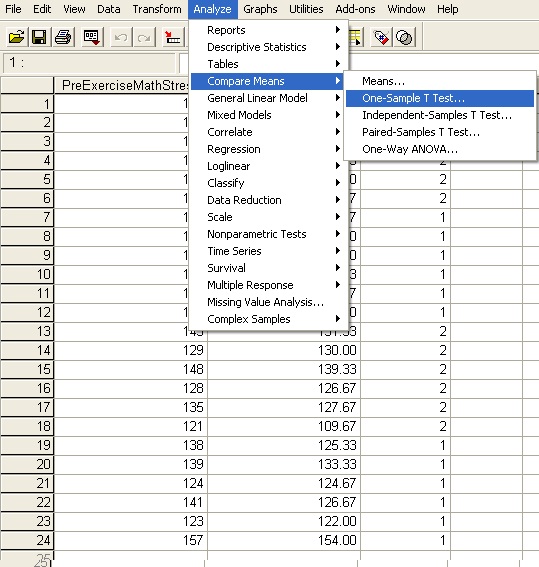
 If you were asked to test the data set PreExerciseMathStress to see if the mean of the distribution that generated it was 135, you would want to run a t-test. To do that we click on the Analyze tab and choose Compare Means and then One Sample T Test as shown below
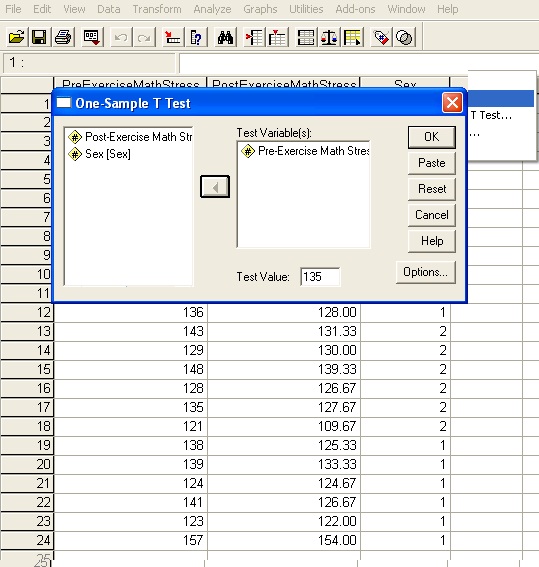
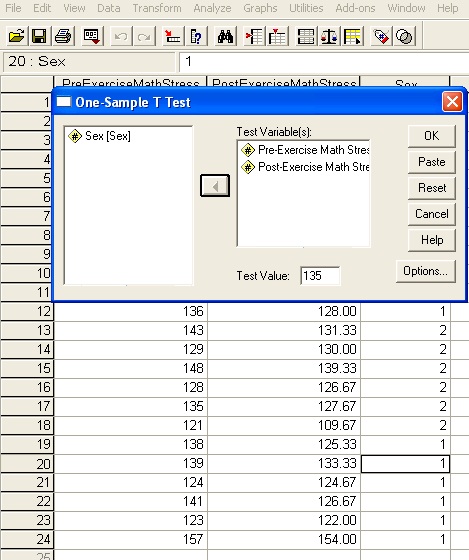
 This opens up a dialog which allows us to specify the columns of data we are interested in studying. We click Pre-Exercise Math Stress and then click the arrow to move it into the Test Variable(s) box. Then in the Test Value box you need to put in the value we want to test. For this problem we have 135, so that value goes there and we click OK.
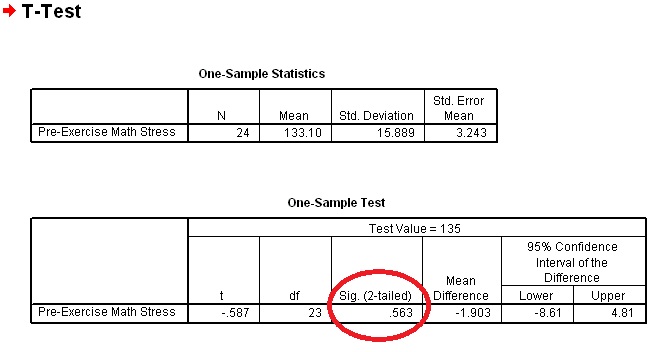
 The key value to notice in the output is the Sig. (2-tailed) box. The value showing is .563, and for us to be able to reject our null hypothesis (that the mean is 135) the value would need to be less than α=.05, or whatever α value you choose. Since it is greater than .05, we fail to reject the null hypothesis. Also note the 95% confidence interval for the mean: since the value 0 is included in the confidence interval, that is another reason why we cannot reject the null hypothesis: because μ-135 could be 0 in the 95% confidence interval.
 Suppose we were interested in testing the two columns of data present, PreExerciseMathStress and PostExerciseMathStress. Specifically, we are interested in testing whether the mean of either of these data sets is 135. We could run two separate t-tests, or we could just have SPSS run them at the same time. Using the same Analyze>Compare Means>One-Sample T Test sequence as before, we open the T Test dialog. This time, however, we slide all the columns we are interested in testing over to the Test Variable(s) box.
 The results of the t test are shown below, specifically there are 2 significance values with each columns getting 1. The row of data relating to Pre-Exercise Math Stress is the same as before, but now there is a second row of results relating to Post-Exercise Math Stress. This new row has a significance value less than α=.05 (and a confidence interval which does not contain 0) which means we can reject the null hypothesis for that data set.
