425/525 Statistical Methods
Spring 2011
Instructor: Michael McCourt
SPSS References: Entering Your Own Data
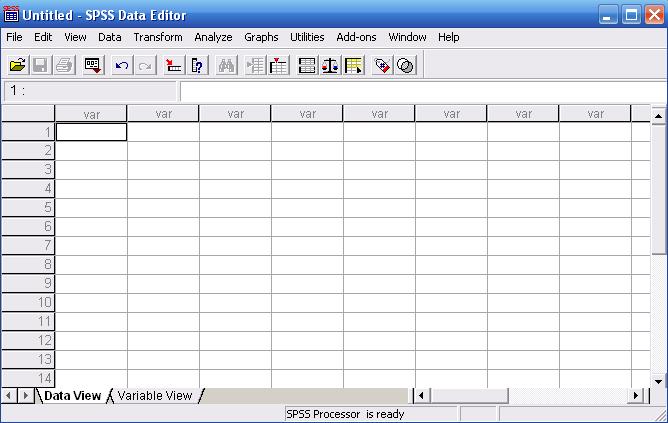
If you don't have your data in a file, but would rather input it manually, you can do that as well. Starting with a blank screen looks like this:
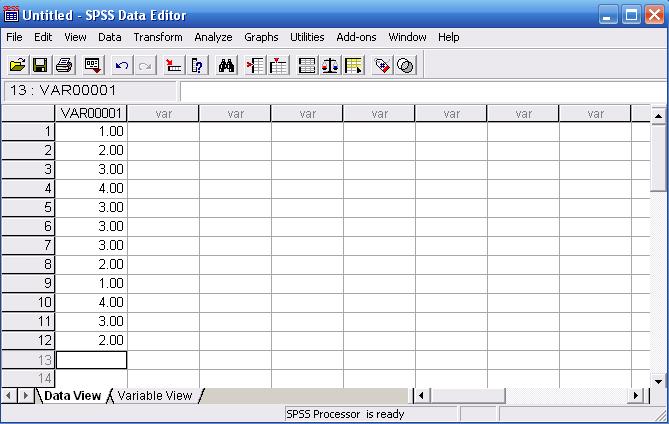
 Suppose you were given the data set {1,2,3,4, 3,3,3,2, 1,4,3,2}. You can enter that into SPSS by simply typing all those values in a column.
 If you were interested in changing the label on this data, double click on the column header. You can also click on the Variable View tab below the spreadsheet. The resulting screen should look like:
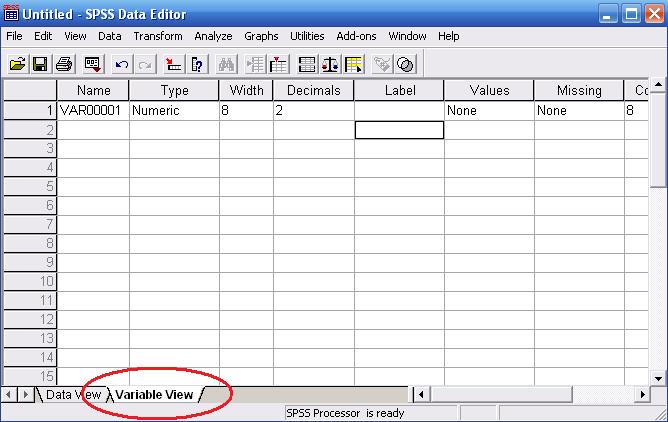 You may change the value VAR00001 to Ranking, or whatever you like. Note that you may also change the type of the data to a string or some other variant. If you wanted to make a histogram of the data you have, you can use the graphs tab as shown below. NOTE: As we noticed in class on Feb. 3, this version of SPSS and the one loaded on the computers is slightly different, so the interface may be slightly different.
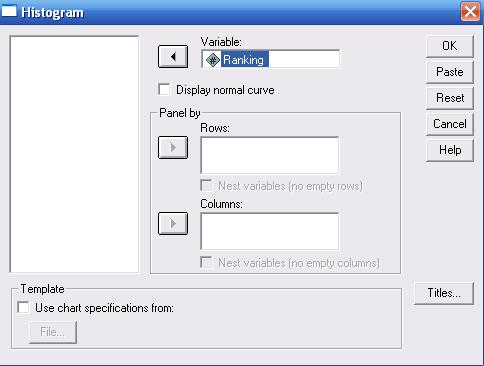
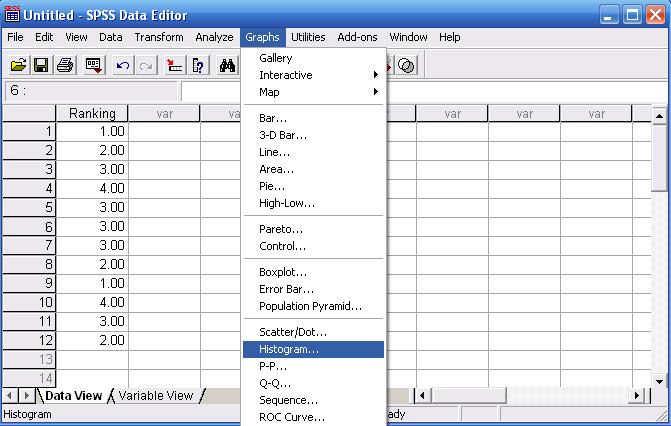 To make a histogram, you have to select the data column you're interested in and click the button next to the Variable location. Click OK to finish.
