425/525 Statistical Methods
Spring 2011
Instructor: Michael McCourt
SPSS References: Analyzing a Frequency Table
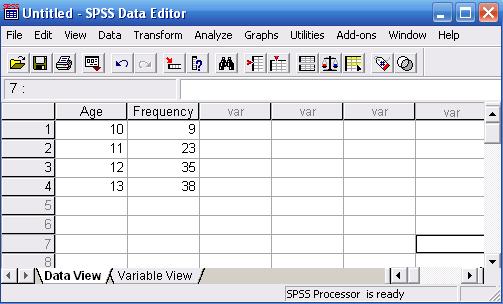
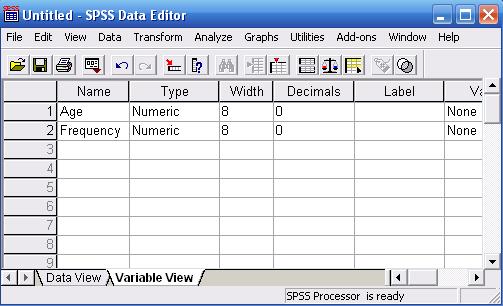
Suppose we put the following data about the ages of athletes in a youth basketball league in an SPSS table. Note the variable names and the choice of displaying 0 numbers after the decimal (since the values are all integers).
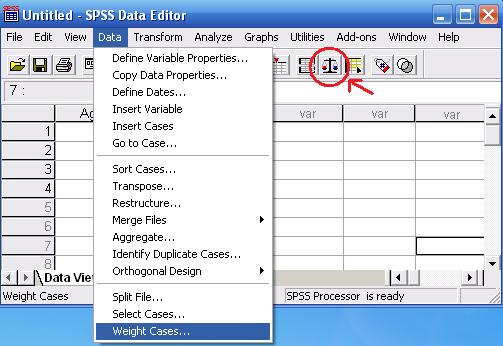
SPSS will assume that the data you have is all frequency 1 unless you tell it otherwise. To associate the Frequency column with the Age column, you need to use the Weight Cases option found in the Data tab (or in the button noted in the picture below):
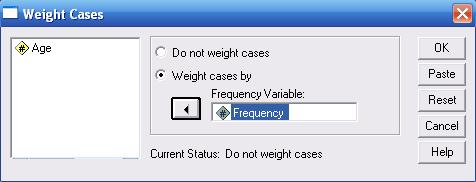
 Once you've selected Weight Cases you must select the "Weight Cases by" radio button, highlight the Frequency column and then move it over to the Frequency Variable area.
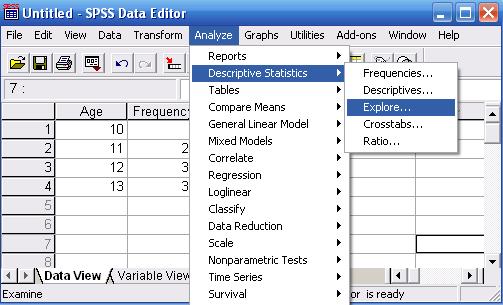
 Now, everything you do will be associated with the frequencies in the column labeled Frequency. If you are interested in descriptive statistics (as of today really the only thing we've learned thus far) use the Analyze tab as shown below:
 Highlight the data set you are interested in studying (in this case Age) and move that variable over to the Dependent List. To activate more statistics to study, you can click the Statistics or Plots buttons at the bottom (note the red and blue circles respectively).