425/525 Statistical Methods
Spring 2011
Instructor: Michael McCourt
SPSS References: Correlation and Regression
If you're only here to check out the part of this tutorial on regression, I've put a separate link to that:
For this tutorial on correlation, I would recommend looking at the Systolic Blood Pressure data set. Boot up SPSS and load that data set
from the course website. Suppose we are interested in determining if there is any correlation between the Pre Exercise No Stress BP and the
Post Exercise No Stress BP. Click on Analyze>Correlate>Bivariate, which should look like
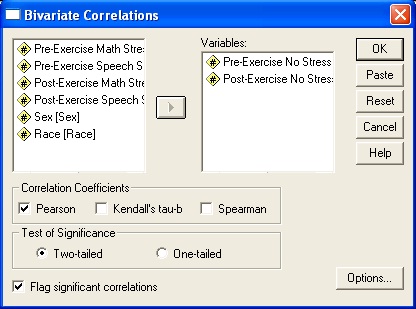
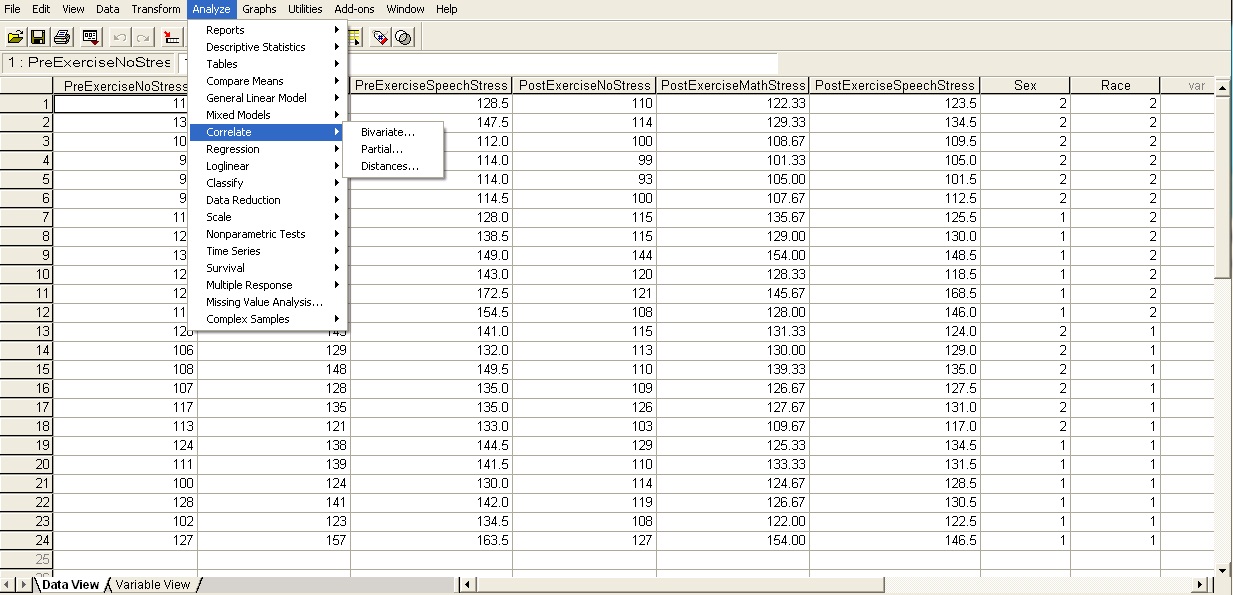 After you do that, slide over the two pieces of data you are interested in studying. Note that you should only study continuous or ordinal data
with correlation as categorical data doesn't make any sense. Also note that we have checked off the box labeled Pearson, since we're not really
interested in the other correlation coefficients.
 After you run the test you should see the following output
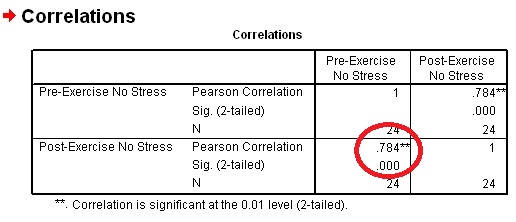 To interpret the output, we can see the correlation coefficient r=.784. That value is significant at the $alpha;=.01 level as indicated by the **
next to the value. Additionally, you can check the sig value which is .000; because that value is less than .05 we can reject the hypothesis that
there is no correlation between these two variables.
Now that we know some relationship exists between the data, we might be interested in determining if the relationship is linear. To test that we can
run a linear regression on the variables to try and find a line of best fit. In order to do that, click on Analyze>Regression>Linear as shown below
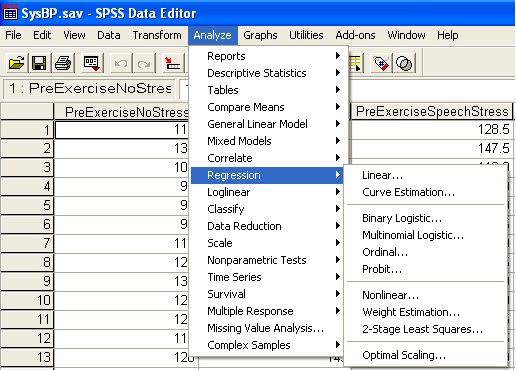 After we do that we need to move over the variables we are interested in studying. For this problem we want to determine if there is given a pre
exercise BP we can determine what the post exercise BP is. That means that the independent variable is pre exercise BP and the dependent variable is
the post exercise BP. See the picture below.
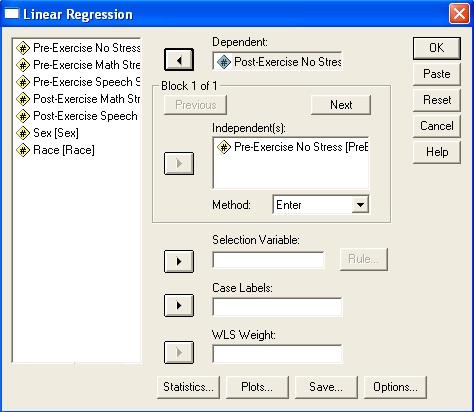 There are alot of options that you can activate in the Statistics, Plots and Options buttons, but we don't really need to worry about those right
now. After you push OK, the test will run and the output should look like this
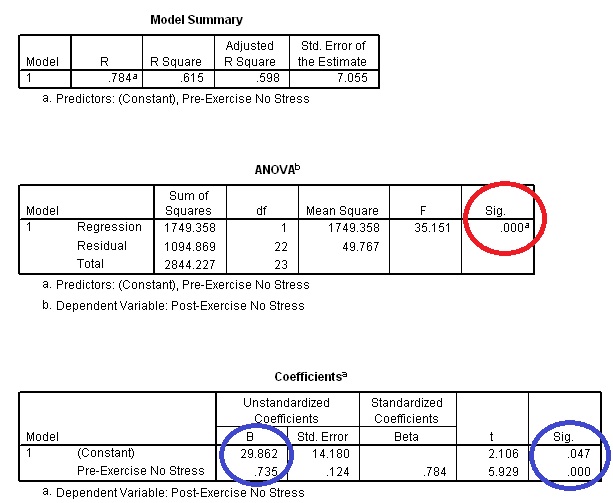 The first significance value circled in red determines whether or not the regression fits the data successfully. Because that value is very small we
can conclude that the regression is doing its job. Below that, we can look at the individual coefficients: recall the regression takes the form
Y=aX+b. The blue circle gives us these values, specifically a=.735 and b=29.862. Looking over at the red circle in the same
row we see that both of those significance values are less than .05 which means that we know our coefficients are not zero at the α=.05 level.


