425/525 Statistical Methods
Spring 2011
Instructor: Michael McCourt
SPSS References: Conducting Chi-Squared Tests
If you're only here to check out other parts of this tutorial, I've put separate links:
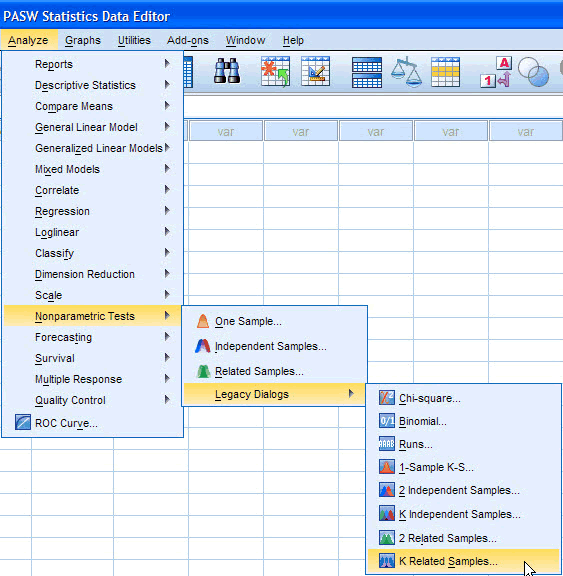
There are 2 different kinds of Χ2 tests that can be conducted in SPSS and they are conducted in different places. Note first of all
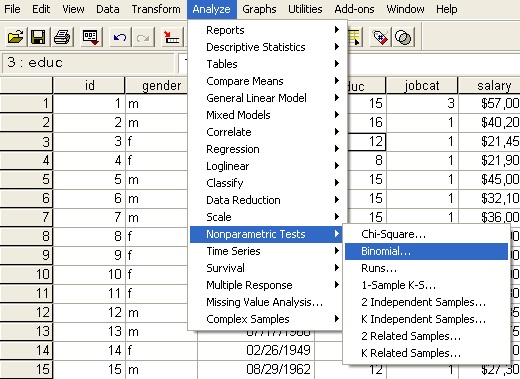
that I will be referencing the Nonparametric dialog for this tutorial. This dialog has changed in the new version that is available on the computer
lab machines, so to access that material I am referencing you should look in the Legacy Dialogs area. A picture below shows what I'm talking about
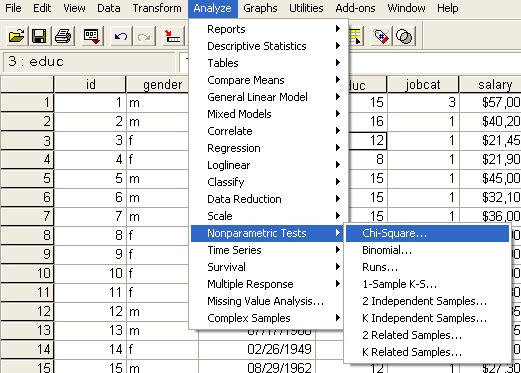
 To run a Chi-Square test for Goodness of fit, let's boot up the data set called Employee Data. Suppose I am interested in determining whether there
are the same number of people doing Clerical, Custodial and Managerial work in this data set. I need to study the column labeled JobCat under
the hypothesis that 1/3 of the people working are present in each category. In order to run that we open up Analyze>Nonparametric Tests(>Legacy
Dialogs)>Chi-Square:
To run a Chi-Square test for Goodness of fit, let's boot up the data set called Employee Data. Suppose I am interested in determining whether there
are the same number of people doing Clerical, Custodial and Managerial work in this data set. I need to study the column labeled JobCat under
the hypothesis that 1/3 of the people working are present in each category. In order to run that we open up Analyze>Nonparametric Tests(>Legacy
Dialogs)>Chi-Square:
 Now we need to move the variable that we're interested in studying into the test list.
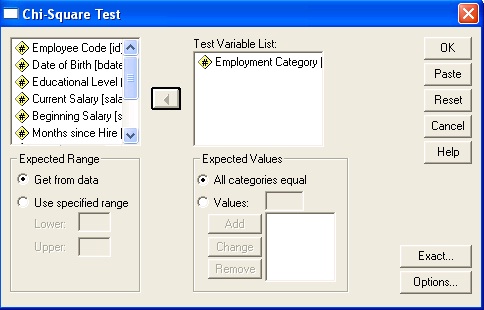 Note the two boxes at the bottom: Expected Range and Expected Values. The Expected Range allows you to tell SPSS what the categories of interest in
the data are, in case you only want to consider a subset of the factors present; in general just leave it as "Get from data". The Expected Values
allow you to change the expected distribution from an even split between categories. If you run the test as it is, you'll get the output
Note the two boxes at the bottom: Expected Range and Expected Values. The Expected Range allows you to tell SPSS what the categories of interest in
the data are, in case you only want to consider a subset of the factors present; in general just leave it as "Get from data". The Expected Values
allow you to change the expected distribution from an even split between categories. If you run the test as it is, you'll get the output
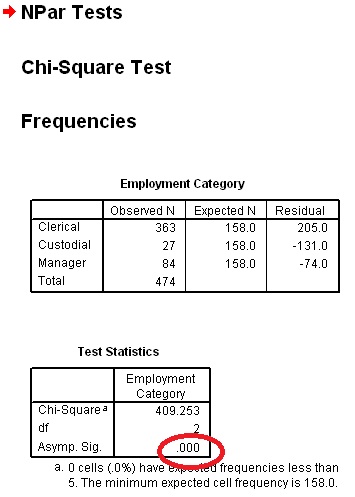 Because the significance value is extremely small (less than .05), we can conclude that there is a significant difference in the population of those
three categories.
Because the significance value is extremely small (less than .05), we can conclude that there is a significant difference in the population of those
three categories.
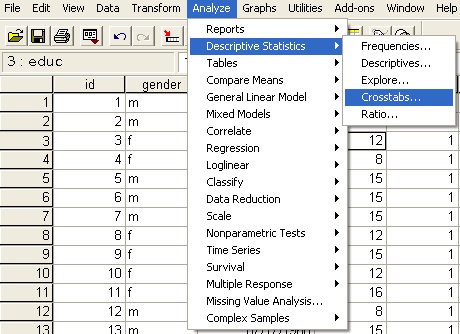
If you were more interested in determining whether someones gender has an effect on their job category, you would want to run a Χ2
test for independence. In this case the null hypothesis would be that the job that you have is independent of your gender. To run this, we need to
click Analyze>Descriptive Statistics>Crosstabs
 We're going to slide gender into the Rows box and employment category into the Columns box, although this choice is arbitrary.
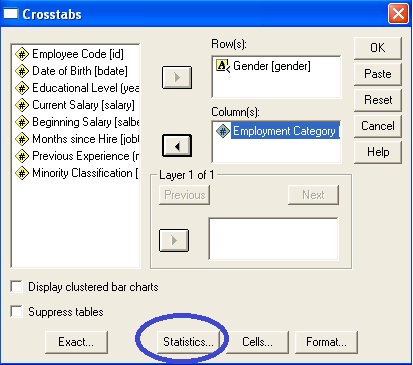 In order to run a test, we need to click on the Statistics box circled in blue above. That will open the dialog seen below.
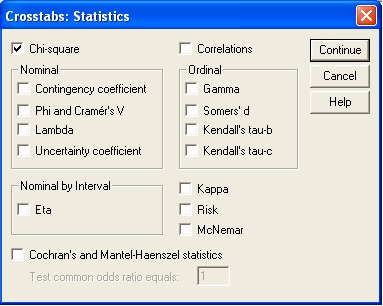 Activate the Chi-Square button as seen above and push Continue. Then click OK to run the test, which should provide the result
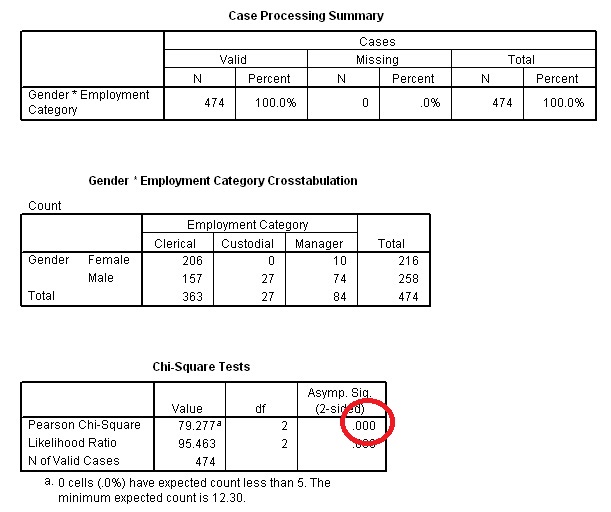 As always, the significance value is circled in red, and because the value is incredibly small, we can reject our null hypothesis. This allows us to
conclude that the job category you are placed in does depend on your gender.
As always, the significance value is circled in red, and because the value is incredibly small, we can reject our null hypothesis. This allows us to
conclude that the job category you are placed in does depend on your gender.
If you continue looking at the Employment Data we might need to determine what the minority enrollment in the workplace is. Looking at the Variable
View of the data we can see that a value of 0 means the employee is not a minority and that a value 1 means the employee is a minority. Suppose we
want to have no more than 75% majority employment - we would need to test the proportion of majority employees with the binomial test. To do this,
we click Analyze>Nonparametric Statistics(>Legacy Dialogs)>Binomial
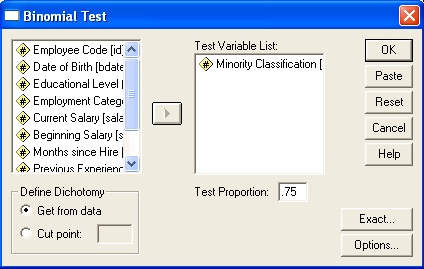
 Move the Minority Classification data over to the test list and put in the value .75 for the Test Proportion.
 Click OK and you should see the result below
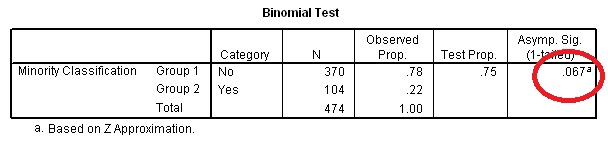 Because the significance value is greater than .05 we cannot conclude that the proportion of majority employees is significantly different than .75.