425/525 Statistical Methods
Spring 2011
Instructor: Michael McCourt
SPSS References: Conducting ANOVA Tests
If you're only here to check out the part of this tutorial on labeling data, I've put a separate link to that:
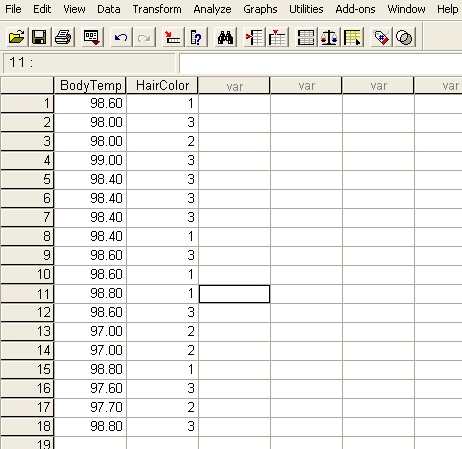
For this tutorial I've put a separate special data set on the web, Body Temperature. This data set has 18 samples studying people's resting body temperature as a function of their hair color. I just made this data up so don't believe these results. If you load that data set in, you'll see the image below
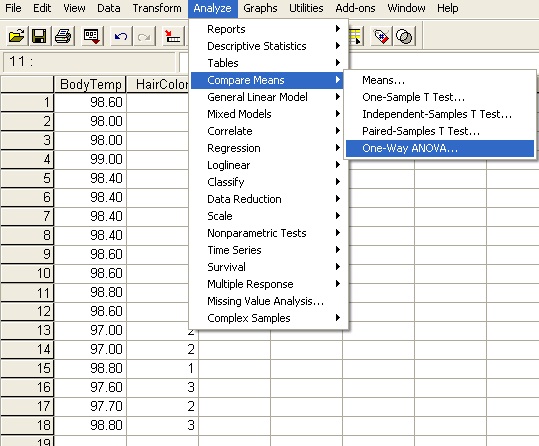
 If you were asked to determine if there is a difference in body temperatures across the three hair colors represented (1=Blond, 2=Red, 3=Gray) you should probably run an ANOVA test. Doing so is very easy. Click on the Analyze>Compare Means>One-Way ANOVA tab.
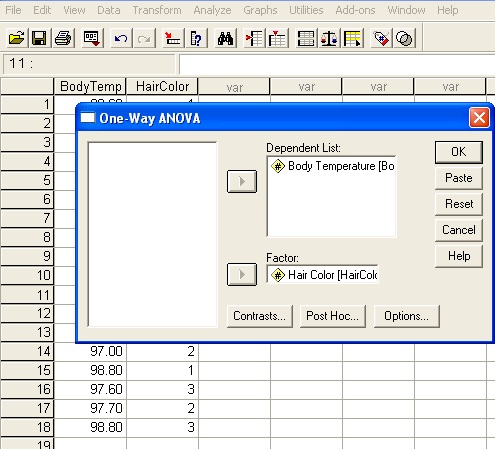
 This will open up a dialog which asks you to specify the variable you are interested in studying and the variable which identifies the hair color of each subject. To test whether the body temperature is dependent on the hair color, you need to move Body Temperature to the Dependent List box, and Hair Color to the factor box.
 If you are also interested in running a post hoc test on the results, click the Post Hoc button at the bottom. That will open up a new dialog, in which you can select any of the post hoc tests available to determine the comparison between levels in addition to the across levels analysis that ANOVA is conducting. Feel free to activate the Scheffe test since that is the test we covered in class.
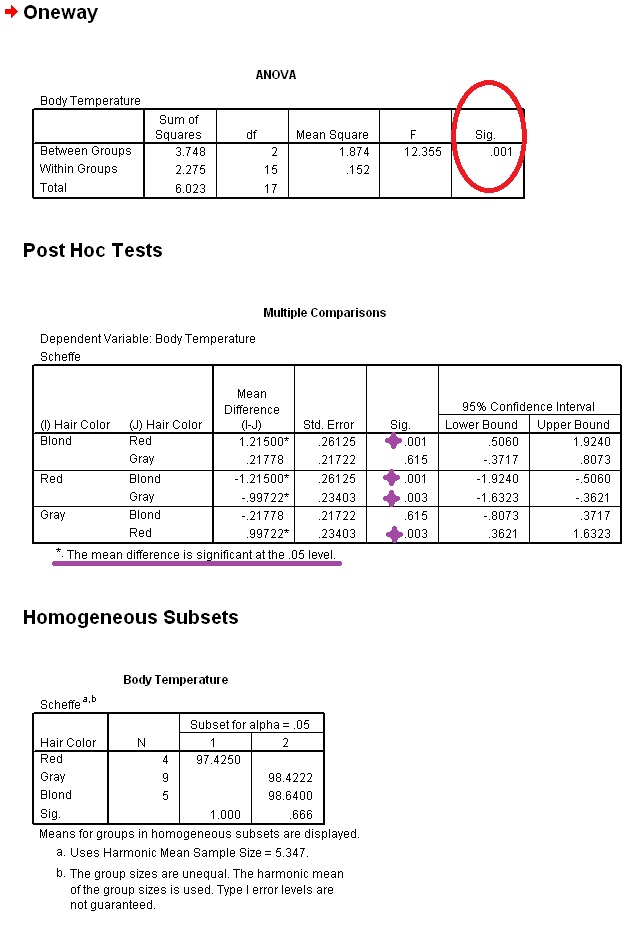
 If you're cool with all the data you've input into the problem, click Continue and then OK. The results of the ANOVA+Scheffe are shown below. The first thing to notice is the outcome of the ANOVA test which is circled in red. Because that Sig. value is less than α=.05, we can reject the null hypothesis that Blond, Red and Gray haired people all have the same body temperature. The question remains, do any of them have the same body temperature?
The Scheffe post hoc test we activated will determine that. In the results for this section, you'll see a line underneath the main box that is underlined in purple - that is the key point to notice for this test. This says that any tests conducted with a start next to them were significant at the α=.05 level. I've put larger purple stars next to the associated significance values to make it easier to spot. These results say that there is a significant difference between blond and red haired people and also a significant difference between gray and red haired people. The test without a star next to it is between blond and gray haired people, which means Scheffe failed to prove that there is a significant difference between those two hair colors.
All of that is summarized nicely in the homogeneous subsets box below the results of the Post Hoc Tests. This shows two subsets of the original three categories: Red is alone in subset 1 and Gray and Blond are grouped together in subset two. The Sig. value beneath the groups is the result of running an ANOVA on just the components of each subset - SPSS determines the best subsets by trying to maximize that value across all possible organizations of subsets. A Sig. of 1.00 as seen for subset 1 is just the default value when you try to run ANOVA on a factor with only one level so we can ignore that. The Sig. value of .666 for subset 2 is much greater than .05, which means we can feel confident about grouping blond and gray haired people together as having the same body temperature.
 That's all there is to it for running an ANOVA, you can ignore the footnotes a. and b. in the Homogeneous Subsets section. The only other thing I would mention is that the Post Hoc section has the words Gray, Blond and Red showing up rather than 1, 2 and 3 as appear in the data. If you're fine looking at the printout of a test and remembering what 1, 2 and 3 represent then you can just use those values in the table.
If, however, you'd rather see what the variables represent on your printout you need to tell SPSS what the numbers 1, 2 and 3 mean. To do that, click on the "Variable View" tab on the bottom of the spreadsheet. You should see something that looks like this:
 The choice of Decimals=0 ust makes sure that the data are presented as integers. All the way to the right, you'll see the choice of Nominal for Measure; this just tells SPSS that although we have numbers in the spreadsheet, they just represent various categories and are not to be treated as real numbers. Neither of those factors matter much, but what does matter is the Values section. In it you can tell SPSS what the values in the spreadsheet correspond to. Click the button inside the Values box for HairColor and it will open a new dialog.
 You can see in the big box at the bottom that each value {1,2,3} is registered as representing a hair color {Blond,Red,Gray}. If we wanted to add a new hair color, such as Brown, we would put 4 in the Value box (or whatever value you choose) and Brown in the Value Label box. Then click the Add button and you should see the results below.
 Now whenever you do analysis with the column HairColor SPSS will know how to label each of the values presented.


